Image composite reductions that require all bands.
Source:R/multiband_reduce.R, R/multiband_reduce_funs.R
multiband_reduce.Rdmultiband_reduce can be used to create composite reductions
that require all band values, such as the geometric median or medoid
composite of a warped VRT collection.
Usage
multiband_reduce(
  x,
  reduce_fun,
  outfile,
  config_options,
  creation_options,
  quiet,
  nsplits,
  recollect
)

geomedian(
  weizfeld = FALSE,
  nitermax = 100,
  nstart = 10,
  gamma = 10,
  alpha = 0.65,
  epsilon = 1e-08,
  impute_na = TRUE
)

medoid(
  distance_type = c("euclidean", "manhattan", "minimum", "maximum", "minkowski",
    "bhattacharyya", "hellinger", "kullback_leibler", "jensen_shannon", "canberra",
    "chi_square", "soergel", "sorensen", "cosine", "wave_hedges", "motyka",
    "harmonic_mean", "jeffries_matusita", "gower", "kulczynski", "itakura_saito"),
  impute_na = TRUE
)

quantoid(
  distance_type = c("euclidean", "manhattan", "minimum", "maximum", "minkowski",
    "bhattacharyya", "hellinger", "kullback_leibler", "jensen_shannon", "canberra",
    "chi_square", "soergel", "sorensen", "cosine", "wave_hedges", "motyka",
    "harmonic_mean", "jeffries_matusita", "gower", "kulczynski", "itakura_saito"),
  probability = 0.4,
  impute_na = TRUE
)

geomedoid(
  distance_type = c("euclidean", "manhattan", "minimum", "maximum", "minkowski",
    "bhattacharyya", "hellinger", "kullback_leibler", "jensen_shannon", "canberra",
    "chi_square", "soergel", "sorensen", "cosine", "wave_hedges", "motyka",
    "harmonic_mean", "jeffries_matusita", "gower", "kulczynski", "itakura_saito"),
  nstart = 5,
  gamma = 10,
  alpha = 0.65,
  epsilon = 1e-08,
  impute_na = TRUE
)
Arguments
- x
A vrt_collection_warped object.
- reduce_fun
A function to apply to the data. This function should take a single argument, a matrix where the columns represent the bands of a cell within a raster stack and the rows represent the time series of that cell. The function should return a vector of the same length as the number of bands. See details.
- outfile
The output file path.
- config_options
A named character vector of GDAL configuration options.
- creation_options
A named character vector of GDAL creation options.
- quiet
Logical indicating whether to suppress the progress bar.
- nsplits
The number of splits to use for tiling. If NULL (the default), the function automatically determines the number of splits based on the dimensions of the input data, available memory, and the number of active mirai daemons. Increasing
nsplitsreduces memory usage per tile but increases I/O overhead. For large datasets or memory-constrained systems, consider setting this explicitly.- recollect
A logical indicating whether to return the output as a vrt_block or vrt_collection object. Default is FALSE and the output is a character string of the output file path.
- weizfeld
Logical. If TRUE, the Weiszfeld algorithm is used to calculate the geometric median - see
Weiszfeld. If FALSE (the default), the Gmedian algorithm is used, seeGmedian. The Gmedian algorithm is faster and intrinsically handles missing values.- nitermax
Maximum number of iterations. By default set to 100. Only used if
weizfeld = TRUE.- nstart
Number of times the algorithm is ran over all the data set. Only used if
weizfeld = FALSE.- gamma
Value (positive) of the constant controlling the descent steps. See details in
Gmedian. Only used ifweizfeld = FALSE.- alpha
Rate of decrease of the descent steps (see details). Should satisfy \(1/2 < alpha <= 1\). Only used if
weizfeld = FALSE.- epsilon
Numerical tolerance. By default set to 1e-08.
- impute_na
Logical. If TRUE, missing values are replaced with an appropriate band-level statistic - in the case of geomedian this is only relevant when
weizfeld = TRUE- in such a case the Gmedian algorithm is used to estimate bands with NA values. For medoid the column/band median is used; forquantoidthis will be the requested quantile probability of the column. If FALSE, missing values are not replaced, which may result in NA values in the output for multiple bands.- distance_type
The type of distance metric to use. Default is "euclidean". See
distafor all available metrics.- probability
The quantile probability to use (0-1). Default is 0.4.
Details
Reducer Functions
The reduce_fun parameter accepts a function that processes a matrix of
band values across time. Built-in reducer functions include:
geomedian(): Geometric median - synthetic, spectrally consistent, outlier-robust.medoid(): Nearest observation to band medians - real pixel values.geomedoid(): Nearest observation to geometric median - combines outlier robustness with real values.quantoid(): Nearest observation to specified quantile - for cases where median is insufficient.
See individual function documentation for algorithm details and parameters.
Custom Reducer Functions
Custom functions must accept a matrix (rows = observations, columns = bands) and return a numeric vector of length equal to the number of bands:
Parallel Processing
When mirai daemons are active (mirai::daemons(n)), processing is
automatically parallelized across tiles. Without active daemons, processing
is sequential.
geomedian
Calculates the geometric (spatial) median across all bands. The geometric median is the point minimizing the sum of Euclidean distances to all observations - a multivariate generalization of the median that ensures spectral consistency across bands. Unlike band-by-band medians, the result is a synthetic pixel that may not exist in the original data but is robust to outliers (e.g., clouds, shadows).
Two algorithms are available via the weizfeld parameter:
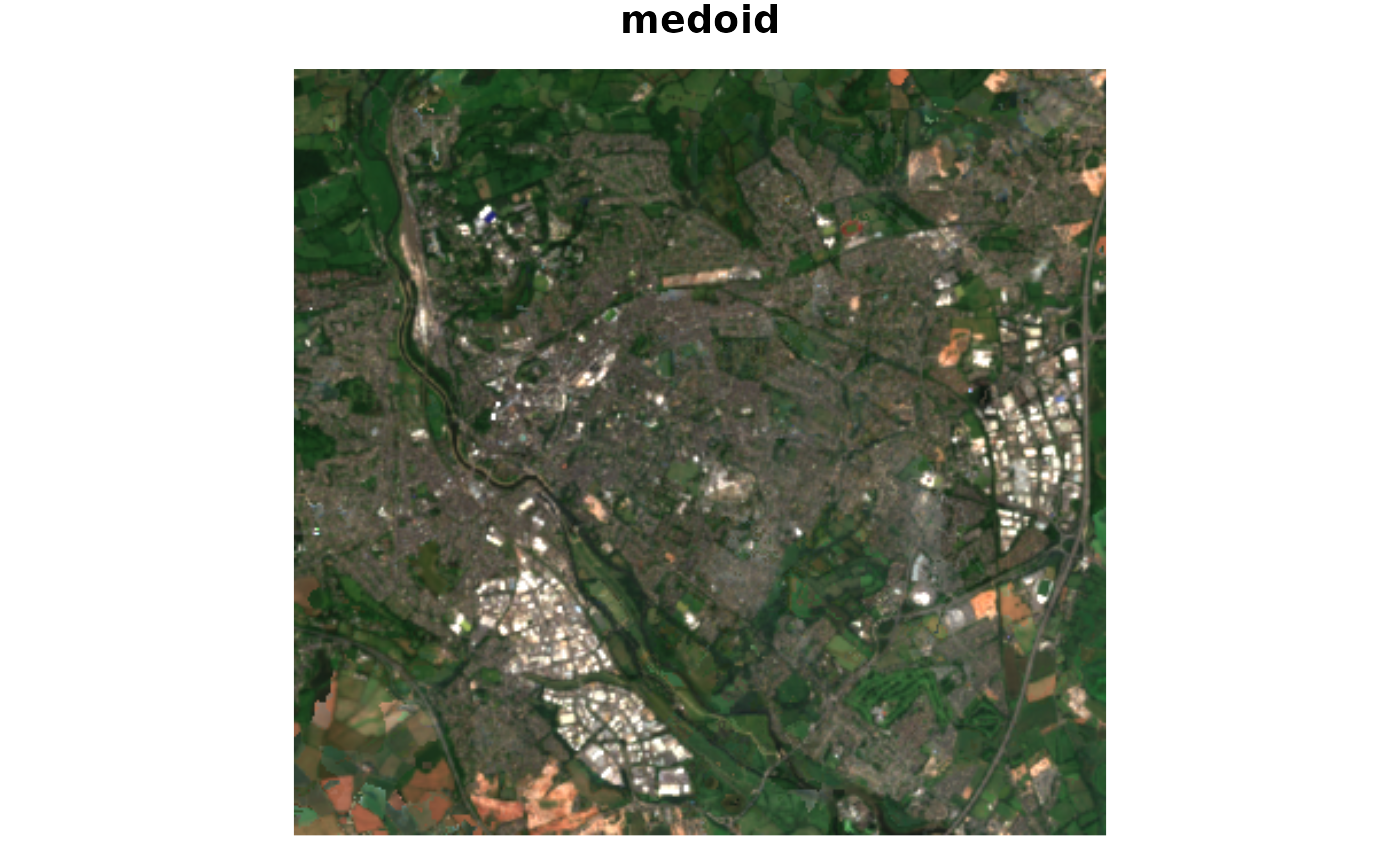
medoid
Selects the observation (row) closest to the band-level medians. Unlike geomedian, this returns actual observed pixel values rather than synthetic statistics, preserving spectral authenticity - useful when real sensor measurements are required.
The algorithm:
Computes the median for each band (column)
Calculates distances from each observation to this median vector
Returns the observation with minimum distance
When impute_na = TRUE, any NA values in the selected observation are
replaced with the band median.
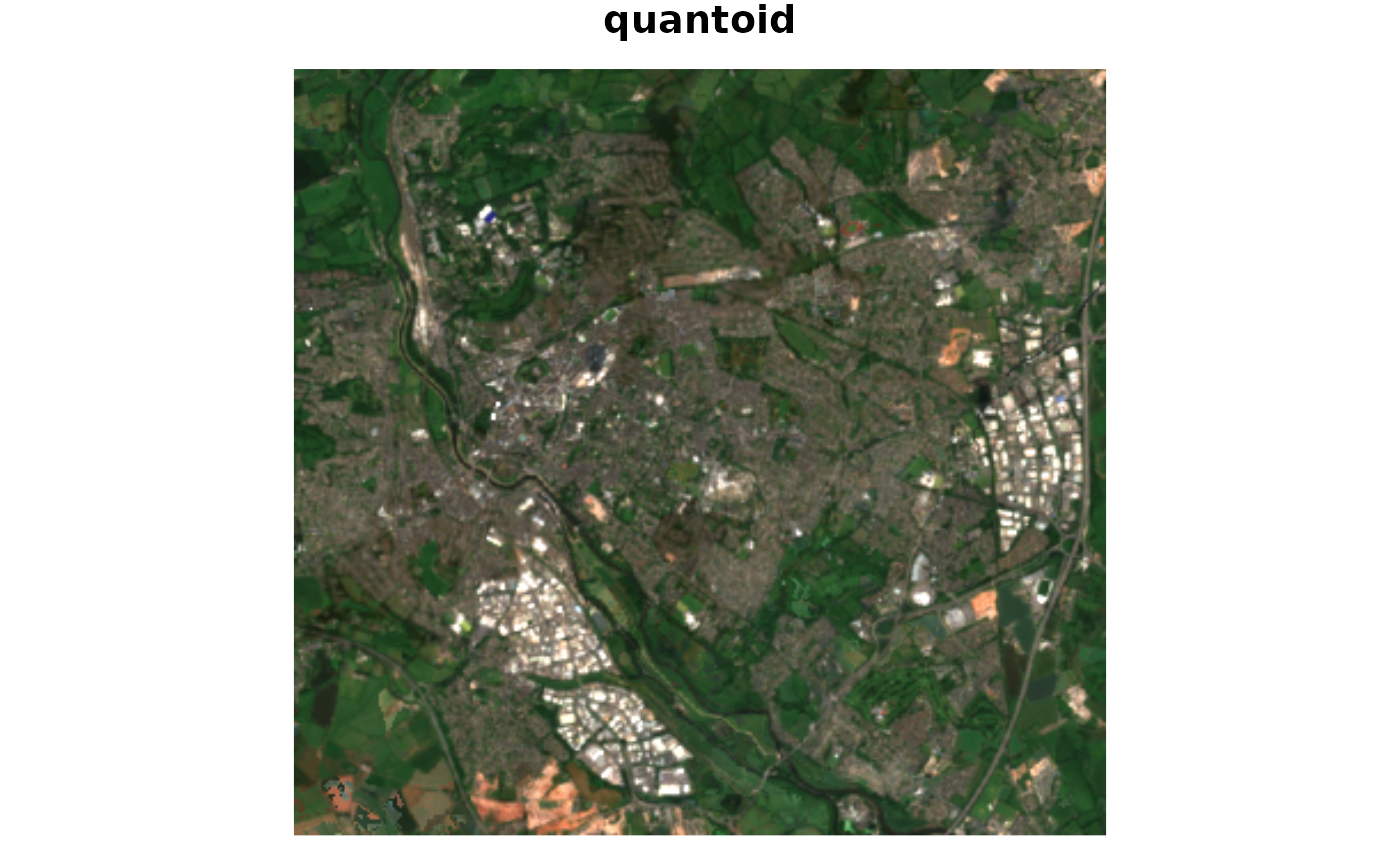
quantoid
Like medoid, but uses a specified quantile instead of the median for distance calculations. Useful when median filtering is insufficient - for example, a lower quantile (e.g., 0.2-0.4) can better reject bright outliers like clouds by biasing toward darker observations.
Requires the WGCNA package. When impute_na = TRUE, NA values in the
selected observation are replaced with the band quantile.
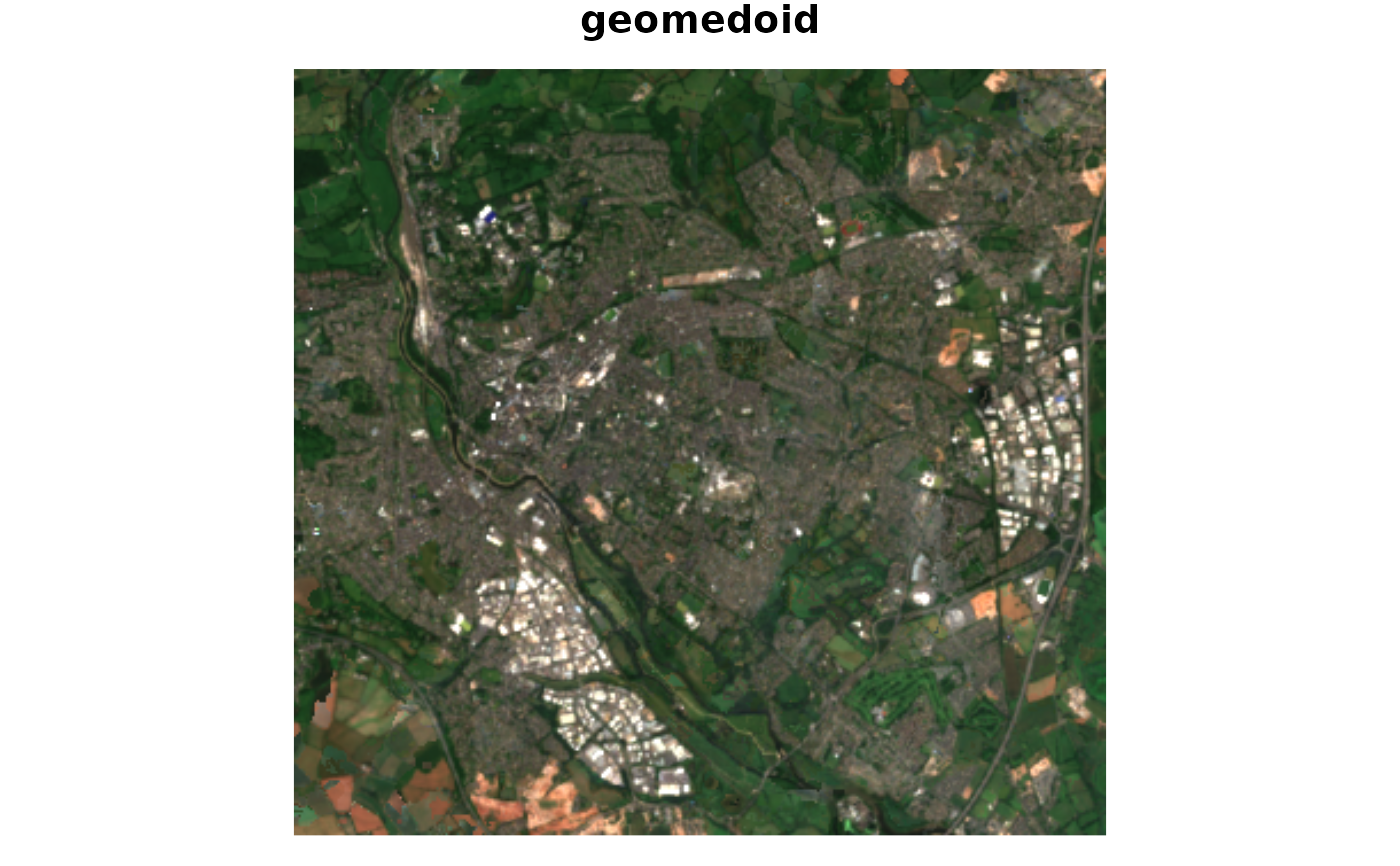
geomedoid
Combines geomedian and medoid approaches: calculates the geometric median first, then selects the nearest observed pixel to that synthetic point. This provides:
Outlier robustness from the geometric median calculation
Real pixel values from the medoid selection
More robust to outliers (clouds, shadows) than medoid alone because the
target point is a geometric median rather than band-by-band medians. When
impute_na = TRUE, NA values are filled using geomedian estimates.
Examples
# mirai::daemons(3) # recommended, especially for larger datasets.
s2files <- fs::dir_ls(system.file("s2-data", package = "vrtility"))

ex_collect <- vrt_collect(s2files)

t_block <- ex_collect[[1]][[1]]

# export each file with mask.
coll_masked <- ex_collect |>
  vrt_set_maskfun(
    mask_band = "SCL",
    mask_values = c(0, 1, 2, 3, 8, 9, 10, 11)
  ) |>
  vrt_warp(
    t_srs = t_block$srs,
    te = t_block$bbox,
    tr = t_block$res
  )
#> Downloading uv...
#> Done!

# create plots of each of the methods to compare.

purrr::iwalk(
    list(
      geomedian = geomedian(),
      medoid = medoid(),
      geomedoid = geomedoid(distance_type = "manhattan"),
      quantoid = quantoid(probability = 0.2)
    ),
    \(.x, .y) {
      geomed <- multiband_reduce(
        coll_masked,
        reduce_fun = .x
      )

      plot_raster_src(
        geomed,
        c(3, 2, 1),
        axes = FALSE,
         main = .y
      )
    }
  )