plot a raster file or vrt_x object
Source: R/plot-RcppGDALRaster.R, R/plot-raster-src.R
plot_raster.RdA wrapper around gdalraster::plot_raster that simplifies the
process of plotting a raster file.
Usage
# S3 method for class 'Rcpp_GDALRaster'
plot(
  x,
  bands = 1,
  xsize = NULL,
  ysize = NULL,
  max_pixels = 2.5e+07,
  scale_values = TRUE,
  col_tbl = NULL,
  maxColorValue = 1,
  normalize = TRUE,
  minmax_def = NULL,
  minmax_pct_cut = NULL,
  col = NULL,
  pixel_fn = NULL,
  xlim = NULL,
  ylim = NULL,
  interpolate = TRUE,
  axes = TRUE,
  main = "",
  xlab = "x",
  ylab = "y",
  legend = FALSE,
  digits = NULL,
  na_col = grDevices::rgb(0, 0, 0, 0),
  mar = c(0, 0, 0, 0),
  ...
)

plot_raster_src(
  x,
  bands = 1,
  col = grDevices::hcl.colors(10, "Viridis"),
  title = c("description", "dttm", "none"),
  rgb_trans = c("linear", "gamma", "hist", "hist_all"),
  col_tbl = NULL,
  minmax_def = NULL,
  minmax_pct_cut = NULL,
  xlim = NULL,
  ylim = NULL,
  interpolate = TRUE,
  axes = TRUE,
  main = "",
  xlab = "",
  ylab = "",
  legend = if (length(bands) == 1) TRUE else FALSE,
  digits = NULL,
  na_col = "#95acbe",
  ...
)

# S3 method for class 'vrt_block'
plot(x, ..., config_options = gdal_config_options())

# S3 method for class 'vrt_stack'
plot(x, ..., config_options = gdal_config_options())

# S3 method for class 'vrt_stack_warped'
plot(x, ..., config_options = gdal_config_options())

# S3 method for class 'vrt_collection'
plot(x, item, ..., config_options = gdal_config_options())
Arguments
- x
A path to a raster file
- bands
a numeric vector of band numbers to plot must be of length 1 or 3.
- xsize
Integer. Desired width of the plotted raster in pixels. If NULL (default), dimension is rescaled in line with the device size.
- ysize
Integer. Desired height of the plotted raster in pixels. If NULL (default), dimension is rescaled in line with the device size.
- max_pixels
Numeric. Maximum number of pixels to read. If
xsize * ysizeexceeds this value, the raster will be downsampled.- scale_values
Logical. Whether to apply scale and offset values from the raster metadata.
- col_tbl
A data frame with the columns: "VALUE", "RED", "GREEN", "BLUE".
- maxColorValue
Numeric. Maximum color value when using a color table.
- normalize
Logical. Whether to normalize pixel values to [0,1] range before color mapping. Automatically disabled for discrete data.
- minmax_def
Numeric vector of min/max values for color scaling. For RGB plots, should be length 6: c(min_r, min_g, min_b, max_r, max_g, max_b).
- minmax_pct_cut
Numeric vector of length 2. Percentile cutoff values for color scaling (e.g., c(2, 98) for 2nd and 98th percentiles).
- col
Colors to interpolate; must be a valid argument to
col2rgb. Ignored ifcol_tblis provided.- pixel_fn
Function to apply to pixel values before plotting.
- xlim
Numeric vector of length 2. X-axis limits in coordinate system units.
- ylim
Numeric vector of length 2. Y-axis limits in coordinate system units.
- interpolate
Logical. Whether to apply smoothing to the raster image.
- axes
Logical. Whether to draw axes and axis labels.
- main
Character string. Plot title.
- xlab
Character string. X-axis label.
- ylab
Character string. Y-axis label.
- legend
Logical. Whether to draw a color legend. Only supported for single-band plots. Automatically detects discrete vs continuous data.
- digits
Integer. Number of decimal places for legend labels. If
NULL(default), automatically determines appropriate precision based on data range.- na_col
Color for NA/nodata pixels. Default is transparent.
- mar
Numeric vector of length 4. Additional margin adjustments to add to the base margins when legend is enabled.
- ...
Additional arguments passed to
plot.window.- title
a character string indicating what to use as the title of the plot. One of "description", "dttm", or "none". If "description" the band description (name) is used, if "dttm" the datetime of the block is used, if "none" no title is used. Ignored if main is provided.
- rgb_trans
a character string indicating the type of RGB transformation to apply when plotting 3 bands. One of "linear", "gamma", "hist", or "hist_all". See details for more information.
- config_options
A named character vector of gdal config options to set before attempting to read the VRT.
- item
The numeric index of the item, in the vrt_collection, to plot
Details
When plotting 3 bands, the rgb_trans parameter controls the type
of transformation applied to the RGB values before plotting. The options are:
"linear": No transformation is applied (default).
"gamma": A gamma correction is applied to enhance mid-tone contrast.
"hist": Histogram equalization is applied to each band individually to enhance contrast.
"hist_all": Histogram equalization is applied across all bands to enhance overall contrast.
Examples
s2_imgs <- fs::dir_ls(system.file("s2-data", package = "vrtility"))
ds <- methods::new(gdalraster::GDALRaster, s2_imgs[2])
plot(
ds,
bands = 4,
legend = TRUE
)
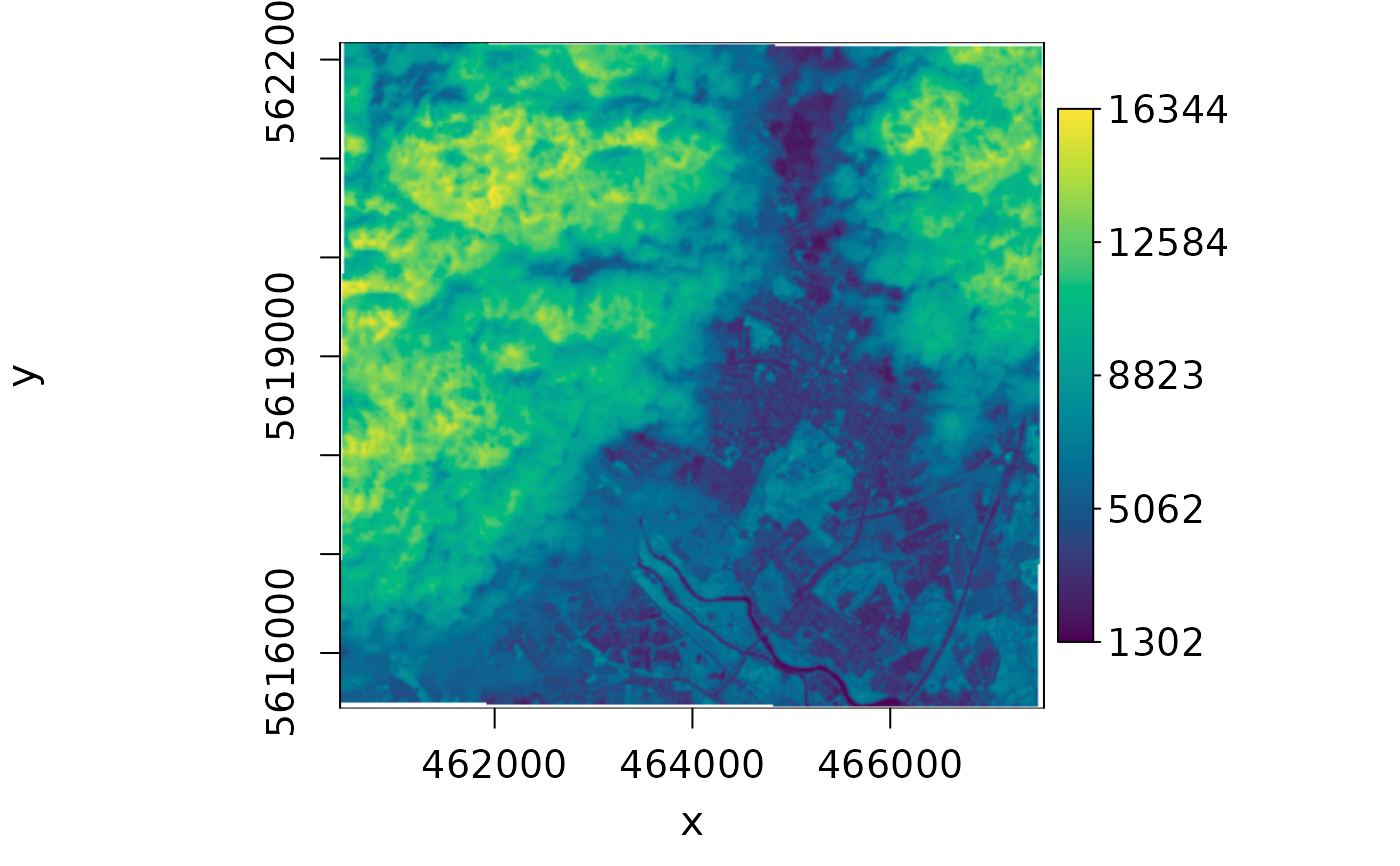 ds$close()
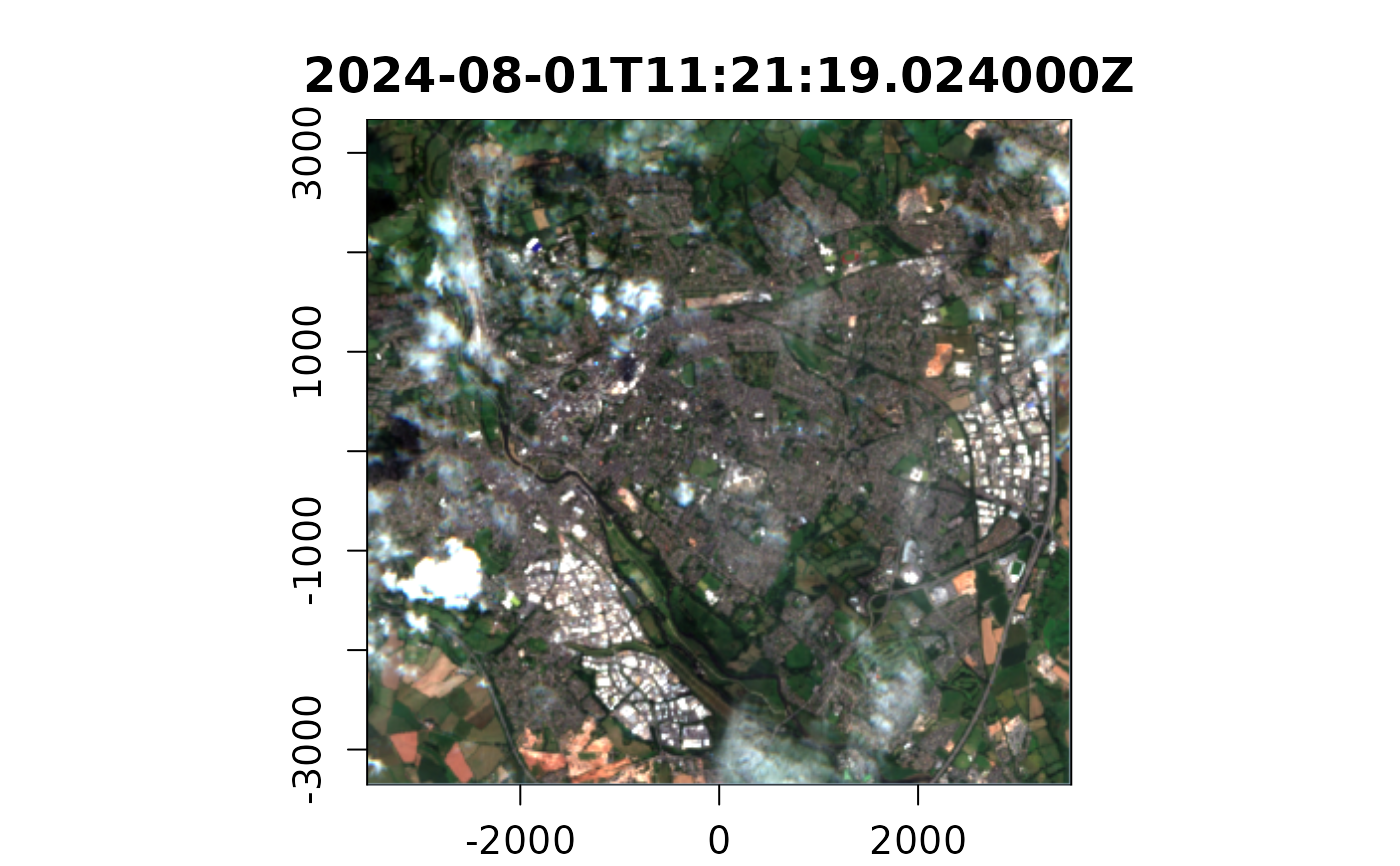
s2_imgs <- fs::dir_ls(system.file("s2-data", package = "vrtility"))
plot_raster_src(
s2_imgs[3],
bands = c(3, 2, 1),
)
ds$close()
s2_imgs <- fs::dir_ls(system.file("s2-data", package = "vrtility"))
plot_raster_src(
s2_imgs[3],
bands = c(3, 2, 1),
)